
Advancements in technology are giving us access to new methodologies that before were too burdensome for computers to work with. New “Big Data” tools allow us to process volumes of data that 10 years ago could not be handled. In the world of industrial engineering, this has given rise to a different way of calculating Engineered Labor Standards, which we like to call Data Driven Standards. Now, with a click of a button, you can calculate a labor standard, whereas with traditional methods it would take tens of hours of observation, study, and engineering to arrive at the same result.
Clean Data is Key
Easy Metrics creates data driven standards with a focus on superior data from warehouse and distribution operations. Data driven standards require clean data, and ideally a lot of it. Clean data is data that accurately tracks the process, time spent on the process, and any associated metrics with the process. The availability of the data determines the accuracy and consistency of the standards. On the most detailed level, this data would be the RF Scan data that feeds the warehouse management system (WMS) software. The RF Scan data normally has the following fields: Employee ID, Time Stamp, Date Stamp, Process ID, Customer ID, Location, and Units/Metrics. By subtracting the time between scans, you can calculate the time spent on every process.
As you go through this process, you will discover inconsistencies in your data. Some of these inconsistencies are from employees not following the process properly on the scan guns, thus creating inaccuracies in the data. The other, and bigger, issue is major data collection gaps. Even the best WMS system, out of the box, will only collect 60% of the work flow in your operation. The other 40% is work flow that isn’t generally captured by the WMS, such as indirect labor, missing time, or direct processes like unload/receiving. The key issue to be aware of is to make sure time spent on non-tracked processes does not end up counting towards tracked processes. This could skew results when building your standards.
Determine Significant Metrics
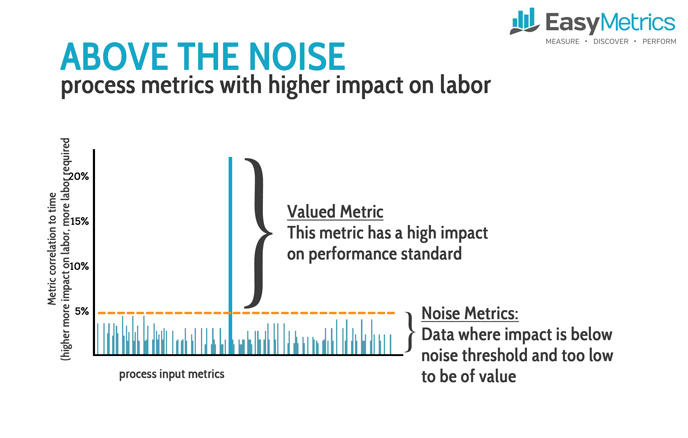
Once you have clean data, the next step is to determine what data is available for your metrics. It is common to believe that more is always better, but this is not always the case. There is a cost to collecting data, which could be additional data capture systems or software configuration of your WMS. Easy Metrics always starts with what is available. Usually about 90% of the metrics needed are in your RF scan data. From this data, you will be able to get information such as UOM (cases, pallets, eaches), number of units, lines, orders, locations, and customer. Any given process, theoretically, can have a hundred metrics. However, there are usually just 1-4 metrics that have a high enough correlation to the standard to be significant. The remaining are just noise.
There is plenty of correlation and regression software available on the internet to help you determine the correlations in your data. This can also be done with spreadsheets; however, a large data set with over 1 million data points will likely overwhelm your hardware. At Easy Metrics, our machine learning tools automatically optimize the metric configuration.
Calculating Standard Deviations
The standard engineering formula is:
Labor Standard = A * (Metric1) + B * (Metric2) + C * (Metric3) + …
Using basic linear regression methods, the computer can tell you what A, B, C, … should be and then what the standard deviation is on your data set.
We find for about 80% of the standards, the above methodology is straightforward and very accurate. However, for the other 20% of standards, we will get a standard deviation on the process standard that is very high. There are two causes of this: 1) not enough data, and/or 2) not enough metrics.
If you are trying to build a data driven standard off of 10 rows of data, you will not have a statistically significant data set to build a confident labor standard. At a minimum we recommend 100 data points, but 1000 or more is ideal. If you have a large data set but are still getting a high standard deviation, then you likely need additional information to build a labor standard. Distance traveled is a common example of this. Your RF scan data will not give you the distance traveled – you need to calculate it based on the distance between locations. When you have a high standard deviation, an industrial engineer can be very valuable. They can better identify additional metric data needed to create an accurate and consistent labor standard.
The above may sound like a lot of work, but Easy Metrics automates much of this process for you. Perhaps most importantly, data driven standards really shine when it comes to maintenance of the standards. Although it takes a bit of work to get your data clean and set up properly, once done, maintaining your standards can be done with a click of a button. As your processes and work flow change due to investment in technology or process engineering, the data driven methodology makes it fast and cost effective to recalibrate your standards.