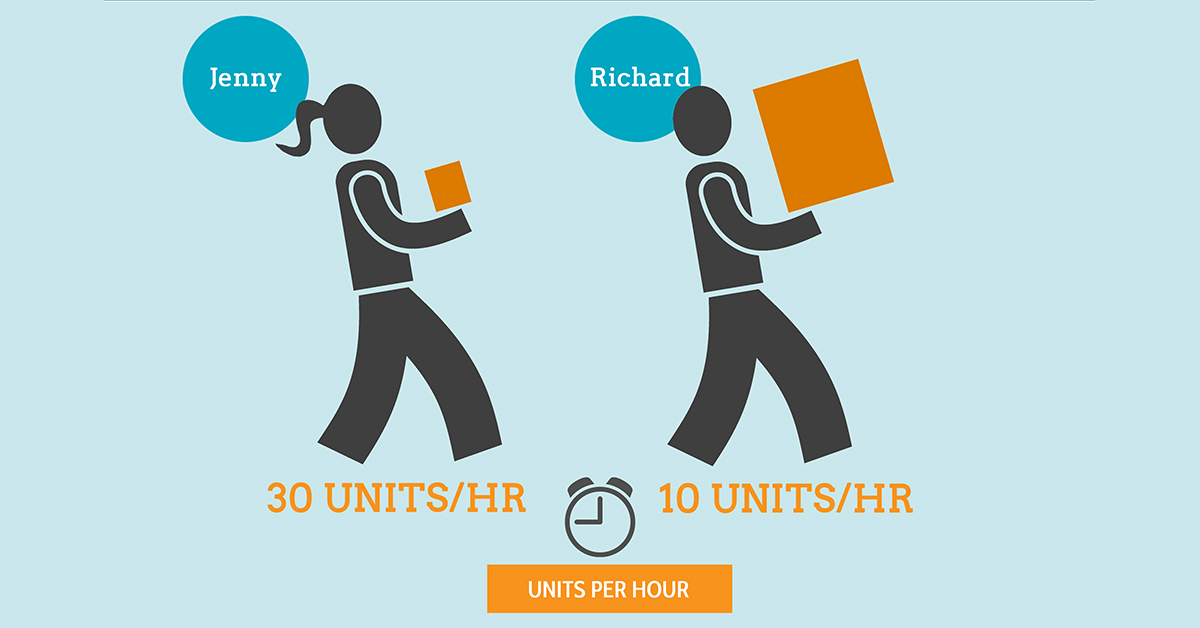
I remember about 15 years ago when we were running a large hard and soft line cross docking operation for a large retailer, the General Manager flippantly stated “A box is just a box.” Queue palm striking my forehead. The operation was a mixed freight cross dock and the GM liked to just look at cases per hour. Some days the freight was what we liked to call “bunny freight”, small number of SKU’s per container and 1500 cases. Other days, it was a nightmare. It could be 200lb BBQ’s requiring a team lift and only 150 cases per container. Or the other extreme with 10,000 cases and over 200 SKU’s. From day to day, cases per hour were all over the place depending on the freight mix. Cases per hour could vary from 50 cph to over 300 cph. To retort bluntly “A box is not a box!”
Companies consistently try to boil the complexity of their operations down to a few single measurements. Cases per hour does work if you are doing the exact same thing every day. But in today’s world of infinite consumer choices, that creates a high level of variance of work flow for manufacturers and distributors. An apple packing company I met with a few years back told me back in the 70’s they had two pack types, bags and boxes. Now they have well over 1000!
The bottom line is the world has changed and how we measure things has to change with it. When you evaluate process performance, you need to take into account all the information available and then model it to create fair and consistent performance/labor standards. This will generally require more than one metric.
In the cross docking example above, we found the primary metrics we needed to create consistent performance standards were:
- Number of cases
- Number of splits (a split is a combination of SKU’s and destination DC’s. You can have a 1 SKU container, but if you have 6 outbound DC’s, you would have 6 splits. So you can see, if there are 200 SKU’s and 6 outbound DC’s, your splits grow arithmetically.)
- Team lift – yes or no. (was about 5% of total freight)
- Palletized – yes or no. (almost all the freight was floor stacked and unclampable)
- Shotgun freight – yes or no (this is when the freight in the arriving container is all jumbled. Typically when you open the container door, the freight just comes tumbling out.)
There were many more metrics available, but we found that they had a nominal correlation with the performance standard. Some other metrics available were case cube, case weight, travel distance, and container total cube. This is where we differ from traditional industrial engineering approaches. Easy Metrics uses a Big Data correlation and regression model to determine the labor standard. Our algorithmic engine evaluates the correlation of each metric to the actual standard then calculates what each coefficient should be in the labor standard. Industrial Engineers tend to try to use as many metrics as possible, no matter how minuscule the correlation. We have often seen up to 15 metrics used to create a labor standard which can be very expensive to both develop and maintain. In our experience, 2-4 metrics create over 95% of the labor standard so you seldom have to go beyond that.
To create the performance standard, the formula is pretty straight forward.
Standard = aX + bY + cZ ….
Where X, Y and Z are the numbers in the metrics and a, b and c are the coefficients multiplied against them. The output then is a performance score. If the employee performs at standard, they get 100%.
In the cross docking example, we broke it down to 3 processes and the following labor standard formulas:
- Cross Dock – labor standard = a*(cases) + b*(splits)
- Cross Dock Team Lift – labor standard = a*(cases) + b*(splits)
- Cross Dock Shotgun – labor standard = a*(cases) + b*(splits)
For each process, using our regression model, the a and b were different numbers. The end result was a fair and consistent performance standard for each employee. The floor supervisors could easily see how each person was performing regardless of the freight mix.
Using this approach, when we were running cross docking operations for a large retailer, we took the average cph from 80 to over 200 in 6 months saving the client substantially in their labor spend. There is a bit of up front effort, but the returns are well worth it.


