Most operations have some kind of continuous improvement initiative ongoing at any given time. There are a variety of continuous improvement methodologies: Kaizen, Six Sigma, Lean and Total Quality Management are all good examples. One of the most common improvement models is the PDCA (Plan, Do, Check, Act). Each step is distinct and intuitive:
- Plan: Identify an opportunity for change, and create a plan to reach that goal.
- Do: Implement that change on a small scale (to start).
- Check: Gather information after each new change, and analyze its effectiveness.
- Act: Implement successful changes on a wider scale while continuously assessing your results. If the changes did not work, begin the cycle again.
Of these four steps, the third has consistently proved to be the most challenging for operations environments. Collecting, compiling, and transforming the data into useful metrics can be complex and overwhelming. What metrics are companies using to measure effectiveness of a continuous improvement project? How are those changes and improvements affecting their costs? Most organizations will use observations, time studies and spreadsheets to evaluate these results. While this can work for some use cases, it is very labor intensive and difficult to maintain on an ongoing basis. Augmenting this process with a tech stack and tooling purpose built for measuring continuous improvement can give you more accurate results, a clear before/after picture, and enable scalability.
Metrics of Continuous Improvement

Cost – Before/after cost in dollars. An example would be reducing picking cost for a certain customer from $2.50 per pick to $2.25 per pick, which is a $0.25 per pick cost improvement.
Time – Time reduction to perform specific processes. An example would be reducing meeting times from 1.0 hours per day to 0.5 hours per day by installing reporting or public display systems that eliminate the need for meeting time. For a 100-person operation, that is 0.5*100 = 50 hours per day, or 12,600 hours saved per year.
Safety – Number of workplace incidents reported, observations of unsafe acts, observations of unsafe conditions, hazards reported, and safety corrective actions are all possible safety metrics. An example would be investing in a pay for performance program that reduces incidents reported because employees are financially incentivized for better performance, causing more engagement and a sense of accountability.
ROI – Return on investment % is the financial return of an investment divided by the cost of that investment for that period of time. An example would be $2.0M in labor cost savings due to a $1.5M equipment investment returns a 133% ROI ((2/1.5)*100).
Quality – Quality metrics include order picking accuracy, % orders returned, on-time shipment %, inventory accuracy, and more. An example would be to separate value added services (VAS) and kitting into its own department and consistent team. VAS cost to serve by customer would be another metric from this example.
It’s difficult to measure the success of your outcomes without first defining a common set of units or metrics to measure with. So what are the key metrics and measurements of continuous improvement? And importantly, how do they all translate into your costs?
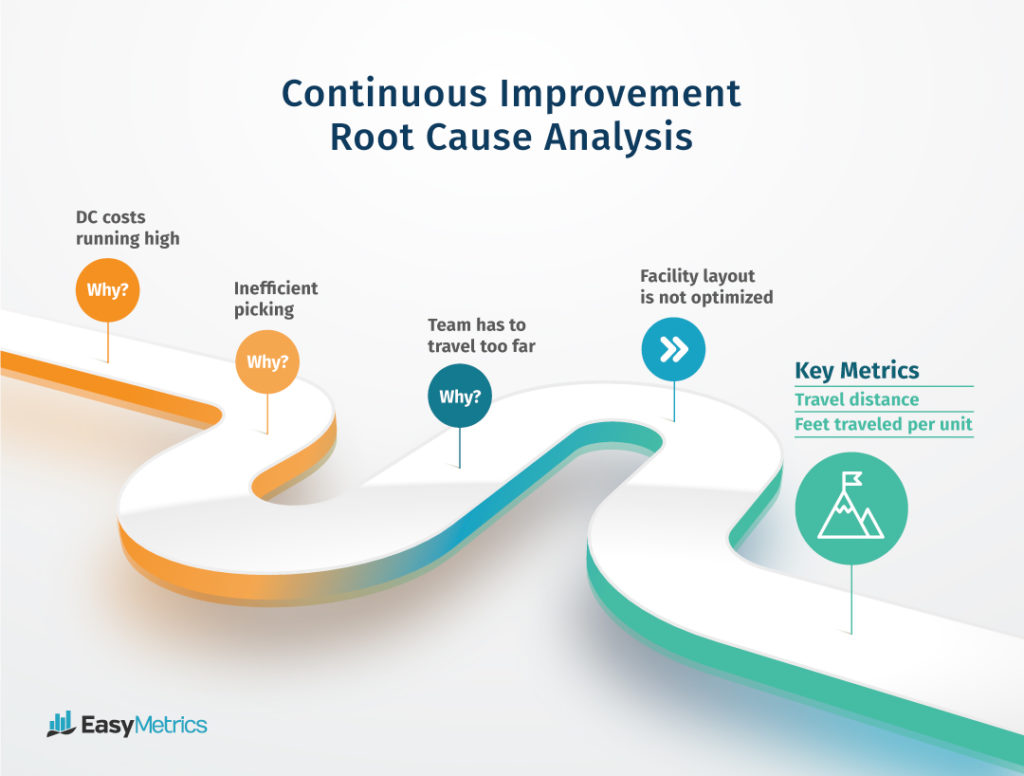
Answering these questions requires asking the question “Why?” using Root Cause Analysis. For example, let’s say you have a distribution center that’s running high on costs. Why? The answer might be that they’re losing money on inefficient picking. So why is their picking process inefficient? It could be because the team has to travel unusually long distances for each unit. Why? Because the physical layout of the facility isn’t well optimized. Now you’ve identified the starting point for improvement and optimization: Travel distance, or feet traveled per unit. The longer the distance, the higher the cost. You now have your key metric for measuring your improvement on this specific process.
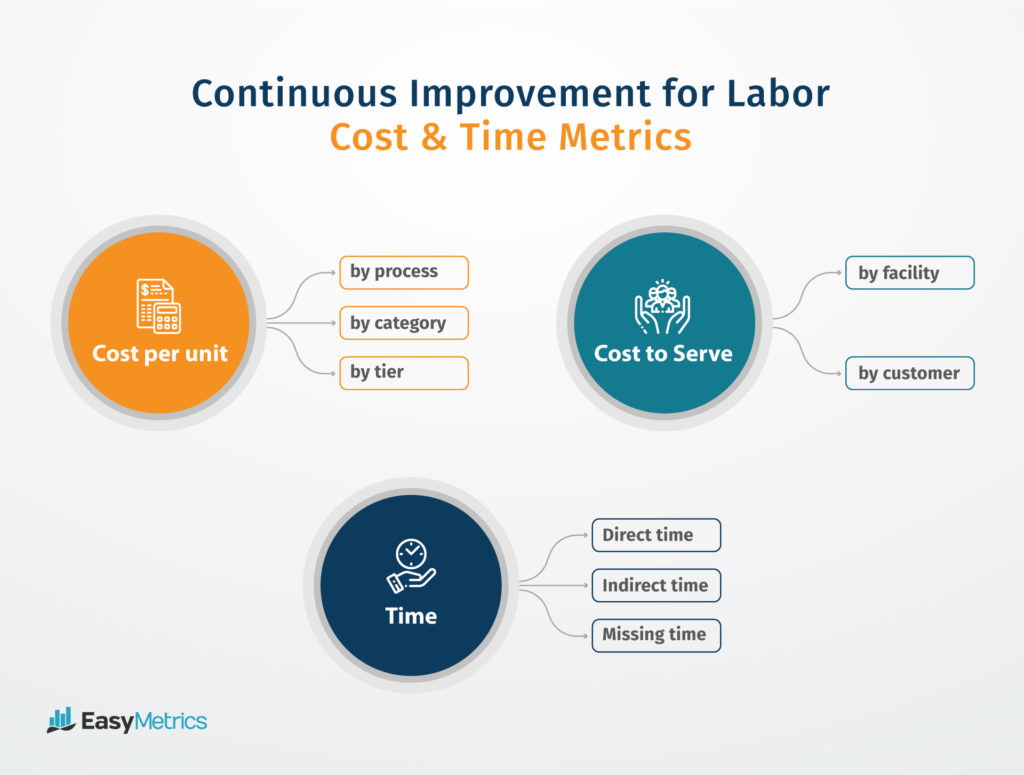
Another way to look at continuous improvement as it relates to labor measurement metrics is simply time and cost. Cost per unit, can be broken down by process, category, and tier. Cost to serve can be broken down by facility or by customer. And time can be measured by any combination of Direct Time, Indirect Time, and Missing Time.
The trick is digging down into the core problems, and fixing them from the bottom-up. This is the classic form of continuous improvement–but we think our more holistic approach is better.
Let’s discuss a concrete example of Easy Metrics’ approach to continuous improvement. One of our customers came to us to help reduce their operations costs. Our goal was to locate the various cost buckets of potential savings, and then address them in order of impact. By pulling data from around the facility, we found that they were spending an abnormally high amount of time and money on forklift battery changes. Upon investigation, we found that the forklift drivers were lining up for battery changes right before going on break, allowing them to artificially extend their break by half an hour or more. Our cost analysis located an anomaly in their cost structure not related to productivity metrics, which then allowed us to locate the cause. With this information in hand, our customer was able to set battery changes on a set schedule, saving $75,000 per year at that facility. This is one small change at one facility that led to permanent gains, which is the power and purpose of continuous improvement.
Tools and Data Required to Effectively Measure Continuous Improvement
Easy Metrics can integrate quickly and easily with your work flow data, and provide objective cost and performance metrics on all the processes in your operation tracked by your data systems. We integrate with the following workflow systems:
- Warehousing/Distribution: Timeclock data, WMS data (transaction file), WES Data.
- Manufacturing: Timeclock data, MRP data, MES data.
- Customer Service: Timeclock data, CRM data.
- Transportation: Timeclock data, TMS data
From these data sets, Easy Metrics is able to show you the time spent on each process, the associated metrics for each process, and the cost per unit to perform each process. Additionally, Easy Metrics reveals non-productive time, missing time (variance between time paid per the time clock and the time tracked in your work flow data), and the costs for each. Qualitative data can also be integrated if it’s available.
When you measure a process, cost is the most objective measurement to hold your operation accountable to. As improvements are made, costs should go down. When we work with companies on continuous improvement, we use cost per unit for each process as the baseline measurement. The specific process metrics and labor standards are used by the operation to optimize and affect change. That change will integrate into the cost metric, and if successful, reduces cost. However, traditional continuous improvement strategies are not the most effective way to reduce waste and improve efficiency.
A Better, Faster Alternative to Continuous Improvement: OpsFM
OpsFM, or Operations Financial Management, is the combination of best practices, cost accounting, and tools that allows you to examine every process with respect to its labor cost. Real-time access to labor costs and waste, through purpose-built tools and reporting means that you’ll be able to stack up your opportunities for cost savings in order from greatest to smallest impact. With that information in hand, you can work through each problem in order of greatest impact (or at least budget for it) for massive cost savings.
Easy Metrics’ OpsFM solution takes a holistic approach by providing measurements for all cost centers. One common problem we encounter frequently is that operations focus on a specific process to improve, but lose sight of the big picture. One example is focusing solely on productivity metrics without looking at the time and cost spent on non-productive work and missing time. If you do not track the latter, you may see your productivity improve on direct labor processes–but the unadjusted indirect labor processes will negate any real cost savings. Being able to look at each facility holistically, and track every process and cost, will help keep you focused on the goal: net improvement.
For example, indirect and missing time often represent the largest and most immediate savings opportunity category for any operation. In the average well-run modern day company, it’s common to see up to 40% indirect and missing time–time not going towards productive tasks. On average, about one hour of that time each day is missing time, or time spent on nothing of value. Indirect time, by contrast, is non-profit-generating tasks like breaks, battery changes, and other important support tasks. Our goal is to reduce that 40% as much as possible. This is where we look at each indirect process code and determine which processes can be streamlined or otherwise supported. This is one way our OpsFM solution differs from traditional continuous improvement methods; we monetize the process by looking at the big picture first, determining our ROI for each point of improvement, and then working down the list from most to least impact.
Continuous improvement is the opposite; it starts with the micro process level. In today’s digital world, operational complexities are the new normal. At one time, when operations and customer requirements were consistent and steady, continuous improvement made sense. Using continuous improvement today, in environments where complexity and variability are the norm, is like playing a never-ending game of whack-a-mole. Continuous improvement falls short of what operations leaders actually need to drive out costs and improve efficiencies today.
Thankfully, there is a better way.
If you’re interested in working with us to achieve measurable results in driving improvements in your operations, contact us today for a demo.


