Leverage labor management data to drive process health and efficiency, and root out the causes of inefficient processes.
For hundreds of facilities, Easy Metrics provides analytics for a wide spectrum of product types and workflows. Traditionally, most companies rely upon industrial engineers and consultants to help identify process improvement opportunities. This can be effective, but time intensive and costly. Easy Metrics advanced data modeling automates the chore of identifying which processes are unhealthy and need optimization.
Traditional manual analysis may include Cost to Serve and Engineered Labor Standard comparisons against industry standard benchmarks. These are definitely useful, but advanced analytics offer an entirely new dimension of visibility that makes it quicker to identify process optimization opportunities.
Easy Metrics approaches process health from a few different angles. Across a wide variety of operations, we have identified the key metric ratios for a broad range of processes. In Picking we will look at feet traveled per line picked, lines per order, and so on. On devanning, we look at splits per container, cube per case, etc. These metric ratios give us deeper insight into the nature of the workflow and provide a powerful comparative analysis.
Download the PDF: Normalizing Process Data
Identifying Poor Warehouse Configuration
Example One: Metric Ratios

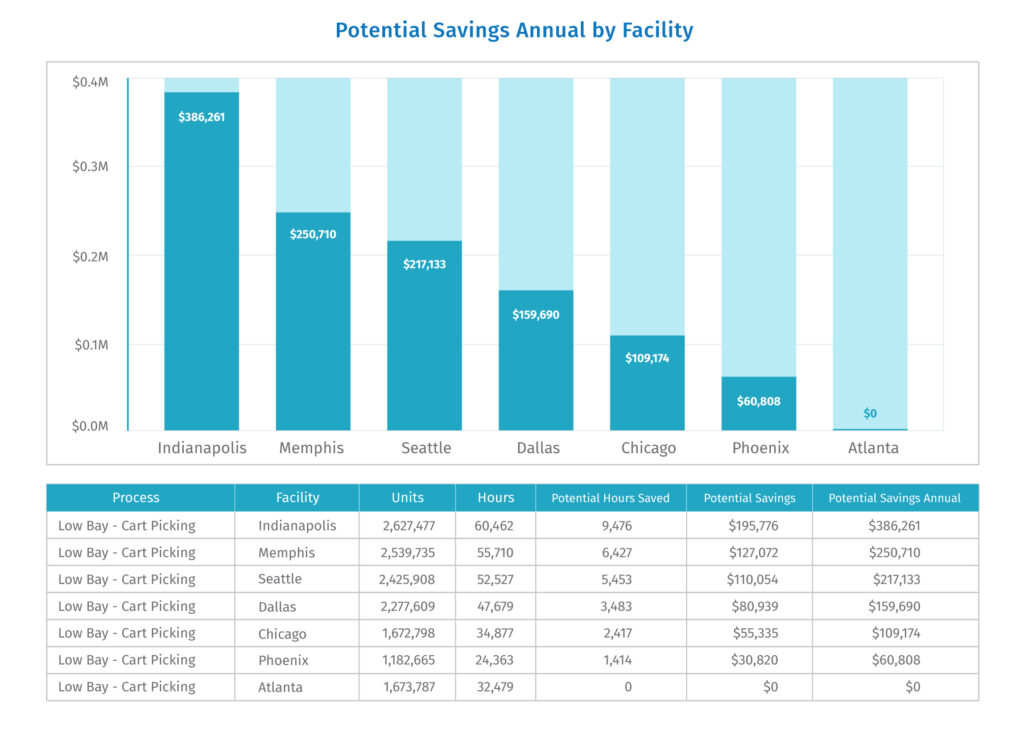
Analyzing key process metric ratios can give you insights into your facility’s process health and performance. As seen above, the Indianapolis facility is spending disproportionately more on the Picking process when compared to other facilities. Drilling down, by analyzing the metric ratios, we can investigate why that might be occurring at Indianapolis. We can see that Indianapolis has the largest percentage of labor spent on this specific picking process.

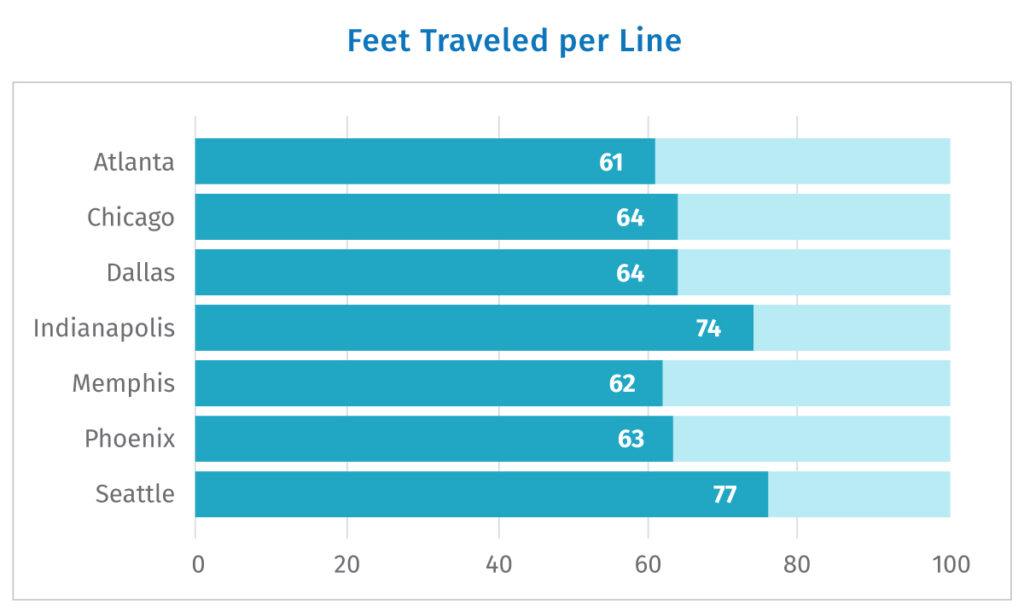
By looking at the Feet Traveled per Line (above) we can see that Indianapolis has about 15% more travel per line than the other facilities. This could be as a result of a unique order mix, or it could be a poorly designed inventory layout, or a poorly configured pick route. This data highlights a possible problem and guides your engineer directly to it, reducing the time it takes for a solution to be found.
Example Two: Workflow Changes

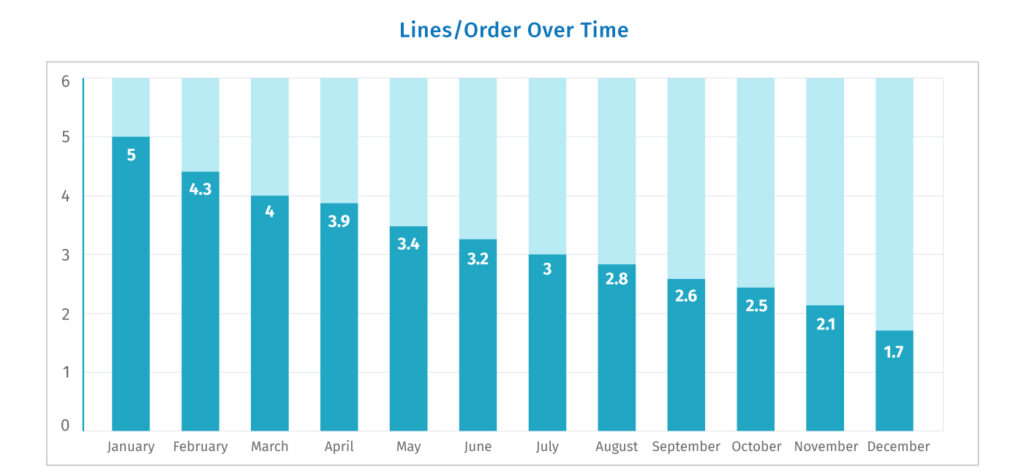
The pandemic created a huge disruption in business workflow as consumers shifted their purchasing habits to more online consumption. This in turn created a major disruption in distribution centers due to the greater labor cost of e-commerce per unit. In the above example we can see that the DC has moved from 5 lines per order down to 1.7 lines per order. Since orders are shipped independently, costs increase substantially per item shipped due to the lower order size. Now that we know the root cause of our increased cost per line, we can adjust our budgets accordingly and see if there are ways to optimize our processes based on the new product mix.
Easy Metrics can help you leverage the real data from your facilities toward diagnosing the health of your processes. If you’d like to learn more, download our Normalizing Data solutions brief or schedule a call with one of our operations analytics experts.


