Comparing process performance and cost across a network of operations.
How are your processes performing? What would happen if your under-performing processes or facilities mirrored your best performing facility? Which processes are efficient, and which processes are inefficient or costing too much? If you have more than one facility with similar processes, you might be sitting on a data goldmine. By comparing similar processes’ cost and performance, facility to facility, you can quickly find where to focus. Some of your facilities might be over-performing and efficient, but those gains can be erased by under-performing facilities.
Facility differences in workflow matter less than you think
A common barrier companies run into is that facilities often run different configurations, operations and workflow systems. From an absolute perfection perspective, this is true, but in reality, there is a substantial amount of similarity between facilities that make network-wide process analysis highly valuable.
Start by normalizing your data
The biggest challenge is in the data. Often facilities will have different nomenclature and even different WMS’s between facilities that make it difficult to link processes and metrics between facilities to one another. Easy Metrics accomplishes this by “normalizing” the data. For each metric and process there is a new field created, and then normalized, for all facilities. For example, “pkg” and “picking” are now called “Picking” in this new field, thus creating a way to link the two process names from those different facilities to each other. The same is done with all the metrics and indirect labor codes.
Download the brief: Normalizing Process Data Across Your Network
Next, compare your similar processes by facility
Once this is done, the company can compare process costs, cost centers and performance across their entire network. From there, the potential cost savings can be calculated by comparing the best-in-class process performance against all the other facilities and what the financial opportunity is for the under-performing facilities to perform at the best-in-class facility level.
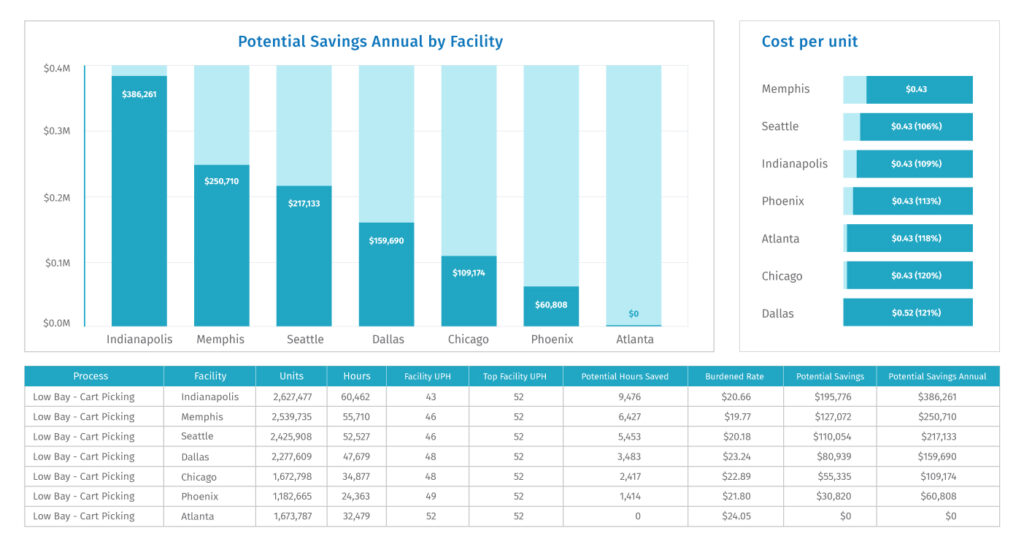
Picking opportunity cost analysis. For this operation, the opportunity cost for its network of facilities for the picking process is $1.2 million if they are able to bring their network of facilities up to the performance of their best facility. This sort of analysis can be performed on every process and used to help guide the entire organization towards best-in-class practices.

What would you do if you found a potential $1.2M efficiency gain? From an ROI perspective, the effort to reclaim these lost funds and boost facility performance by process would easily justify hiring an FTE to tackle just this issue. The added benefits to your organization would be better collaboration and sharing of best practices, a newfound culture of financial accountability, and fostering a growth mindset through performance metrics.
Additionally, this process leads to a more detailed analysis and comparison of process health which will be covered in the next blog. If you’d like to learn more, download our Normalizing Data solutions brief or schedule a demo with one of our operations analytics experts.


