Cost to serve is the measurement of cost factors that go into the servicing of a customer, or the production of a product. When paired with revenue, cost to serve analysis enables you to accurately calculate profitability by customer, product types, production lines, facilities, processes. Cost to serve analysis enables you to accurately identify unprofitable areas of your operation, and mitigate situations where more volume creates larger losses.

It might surprise you to learn that on average, 20-40% of customers are unprofitable. The challenge is differentiating which customers are unprofitable, and which are the most profitable. Cost to serve analysis allows you to see which customers and product types are in the green, and which are in the red. Armed with this information, you can reprice your services, or invest in process improvements and optimization to reduce costs of those unprofitable services.
How is Cost to Serve different from COGS?
We get asked this question frequently, and it’s worth answering here. Think of COGS as including labor, manufacturing and overhead – everything necessary to produce a product. Think of cost to serve as the costs incurred to service a customer. Cost to serve is the measurement of activity costs to meet your customer requirements.
Getting a handle on the cost of operational labor
Globalization and the digital era has radically shifted customer expectations. Operations have been forced to react and meet the demand. Quickly. The problem with having to respond quickly to market demands, like same-day shipping and frictionless returns, is that operations leaders are still required to optimize and drive out costs, simultaneous to the growth. The methods that operations leaders used to rely on to measure, manage, and optimize are obsolete. There’s too much variety in product type and volume, too much customization, and price pressure. What’s needed is a clear understanding of cost to serve, so that operations leaders can make confident data-backed decisions, tackling their biggest cost savings initiatives by order of magnitude.
Data-driven companies like Amazon already do this, with a technology stack that has cost to serve analysis possible at the fingertips of COOs, operations financial managers, continuous improvement engineers, and process improvement analysts. Companies that don’t have readily available cost data—organized by product type, shift, facility, customer, supervisor, and process—are at a serious disadvantage competing against data-driven competitors.
Labor is the largest variable cost in any operation, and the highest cost in any operation that requires a workforce to produce and distribute products. By far, distribution operations rely mostly on labor to fulfill orders, as opposed to automation. Labor is also the most difficult to calculate cost to serve for. Spreadsheets can’t do it, because of the amount of data required as inputs. Thankfully, there are other options that integrate time clocks and process data and other data sources to reveal cost to serve and profit to serve, instantly and in real-time. Operations Financial Management (OpsFM) tooling provides this visibility.
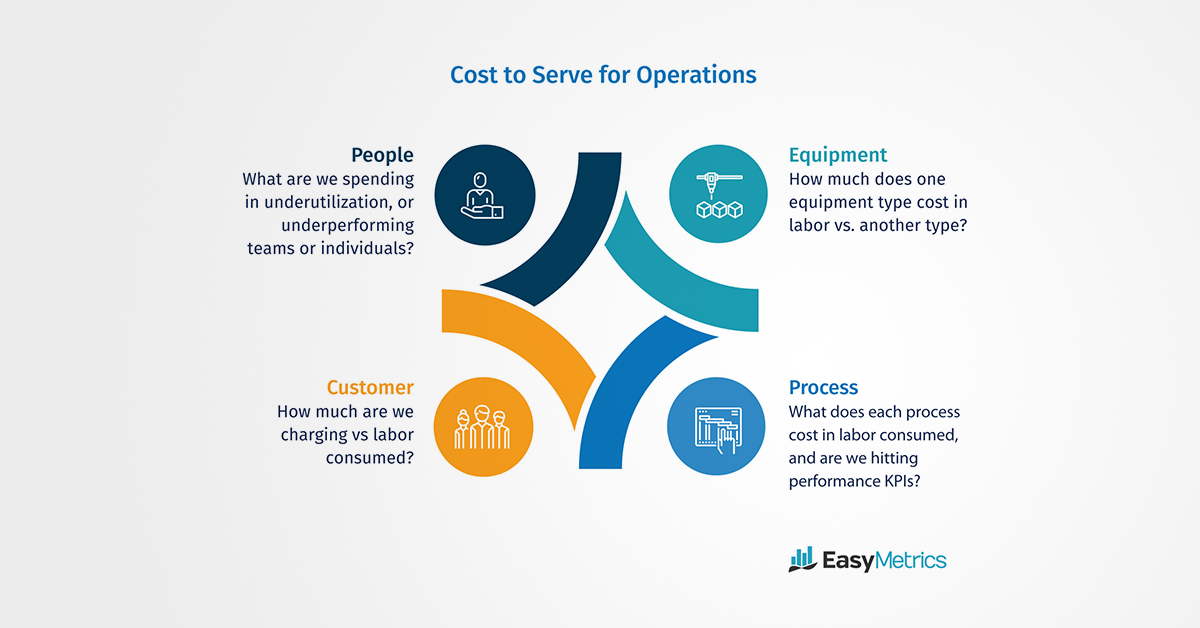
Cost to serve analytics equip operations teams to drive out waste faster than traditional continuous improvement methods. Because cost to serve translates performance into one common language and one common metric – cost – teams are aligned and able to prioritize improvement projects. Understanding costs of people, equipment, customers, and processes are the cornerstones of cost to serve. Without it, it is hard to pinpoint where you are making money and losing money in your operation.
Download the PDF: Cost To Serve Brief
Calculating Your Cost to Serve
There are different methodologies used to determine your cost to serve. The traditional methodology is to use an Excel model to estimate the average cost for each process, then multiply that cost by the transaction volume. The average is usually determined using an estimated labor standard.
For example, it takes 5 minutes to perform a certain process per cost unit. So if there are 12 units, the cost is 1 hour of labor plus the proportional allocation of fixed costs.
This traditional methodology is usually accomplished with spreadsheets with input from an ERP system. There are some commercially available packages that use this traditional approach as well. This methodology can be effective, but it is highly dependent upon both the accuracy and consistency of the time estimates–which are both based on employee performance and volume, and are therefore highly variable. In the modern operation (the digital transformation era) where product mix, workflow, and volume are always in flux, those traditional approaches have become obsolete.
The better cost to serve methodology is fully automated. Easy Metrics cost to serve analytics are automated and go far beyond what analysts can do manually. Easy Metrics integrates with all of the workflow transactional data in a company, allowing you to see the time spent on every transaction, by every employee, for each customer, product, equipment type and process. By merging that data with employee wage data and other cost metrics, Easy Metrics calculates–in real time–your cost-to-serve across all aspects of your operation, even across multiple facilities. Easy Metrics calculates cost to serve based on actual labor spent per process for each customer versus an estimated amount, which is far more accurate than the alternative.
Would you like to see more cost to serve examples? We have dozens of cost to serve examples for distributors here
Historically, determining cost to serve from only transaction data was too challenging for most companies. Easy Metrics solved this problem with its Logic Writer® integration tool. Logic Writer® takes the normally complex process of multi-source data integration and effortlessly automates it. It is able to integrate multiple data sources from WMS, TMS, CRM, MRP, time clocks and telematics into a comprehensive cost and performance model that shows you cost to serve by customer, employee, process, product type, facility, and more.
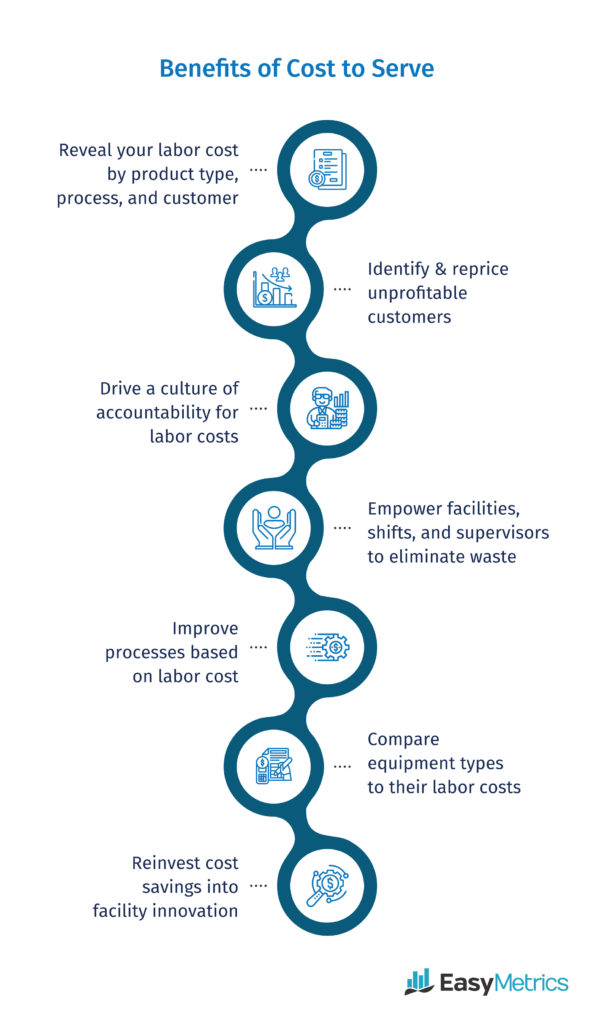
Benefits of Cost to Serve & How to Use it
The true costs of labor by customer, process, or product type are critical financial metrics, but previously invisible to operations. Data integration and analytics make it possible now.
Combat labor cost-overruns and unprofitable labor spend by following these steps:
1. Review your labor cost by customer and product type and compare them to what you are charging for those services. Identify which customer and product types are unprofitable or could be improved.
2. Identify gaps and opportunities for additional investment in facility equipment or layout that will drive better operational profitability in your processes where labor cost is too high and needs to be made more efficient.
3. Monitor progress to ensure new investments and projects are producing and performing.
4. Monitor employee, shift, supervisor, and facility labor costs. Compare labor costs to internal benchmarks and KPIs, and continually cascade cost information to teams for visibility and continuous improvement.
5. Wash, rinse, and repeat. Cost to serve analysis is an ongoing effort that pays dividends over time, as your team continually drives out waste and improves.
Global Competition Makes Cost to Serve a Necessity
Operations that still run cost analytics the old way, by averaging their costs over all customers/products, really struggle and are at a disadvantage against competition who have better analytics. The days of averaging costs are over. It simply doesn’t cut it anymore. You need to know what the true cost is for every product, service, and customer in your business to compete effectively. Armed with this information, you can compete against the competition by driving out waste and pass on those savings to your customers by reducing costs. Or you can fund innovation in your facilities, invest in better equipment, and pay better wages and bonuses to your employees.
Ultimately, cost to serve analytics fuel a better customer experience. If you want an in-depth look at cost to serve, or help educating your team, you can read more about it in our solutions brief.
Ready to have cost to serve analytics in your operations? Sign up for a demo of Easy Metrics today.


