
Covid-19 has created a very difficult staffing environment for all companies. Distribution centers have the challenge of both managing peak season cycles and getting the labor needed to meet their production goals.
Staffing allocation between full time employees and temporary workers is a critical decision. Capacity, workflow, cost and ability to perform tasks are a few considerations. If you over-staff with full time employees, the company will either need to lay off employees during seasonal slowdowns or carry the additional cost. Temporary workers solve the seasonality challenge, but their true cost isn’t as clear as your full time teammates’. While their hourly rate is often the same or lower than your full time employees’, that is not the full measure of cost. Cost to serve is the key metric that needs to be evaluated when analyzing your staffing allocation needs.
Tracking and optimizing the needs, costs, and distribution of your workers
With Easy Metrics analytics, all production data can be allocated between full time and temporary workers. For those companies that utilize staffing firms, Easy Metrics enables the user to break out the cost to serve and performance by each staffing firm as well.
An Allocation Study
Below is a recent analysis done by one of our customers.
Their traditional allocation is 60% full time and 40% temporary workers. After examining their production data in Easy Metrics, they discovered the true cost of using temporary workers. Due to higher turnover and lower productivity, their costs were about 20% higher than their full time coworkers. The company decided to change its staffing allocation to 80% full time and 20% temporary employees.
The forecasted savings across its network is expected to exceed $5 million annually.
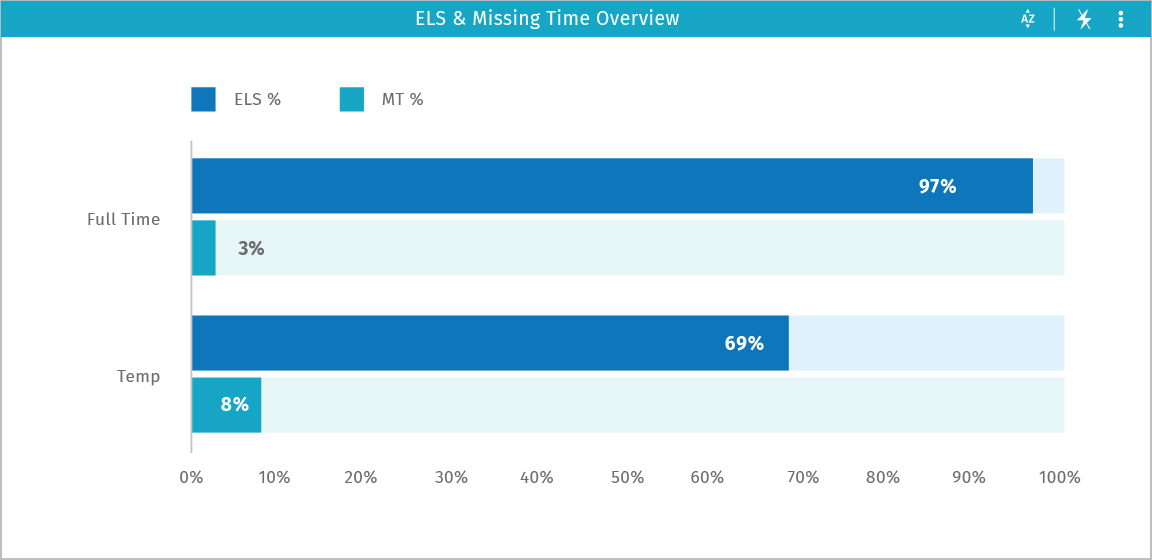
The base wage plus burden (or temp agency markup) is the starting point for determining your optimal staffing plan. A full time employee may earn a higher wage, but the staffing firm’s profit margin usually offsets most, if not all, of this savings. The productivity of temporary employees is usually lower, which means they are processing fewer units during each paid hour. For this customer, their full time employees were operating at 97% of the labor standard, while the temporary employees were only achieving 69%.
If we were to dive deeper we may find that this divide is greatest with complex processes like Case Pick that take longer to master, while more basic processes like Unloading may show similar productivity scores among both full time and temporary employees.
Combining the differences in hourly labor costs and productivity at the process level provides insights into where to allocate temporary labor, and where potential savings opportunities exist.
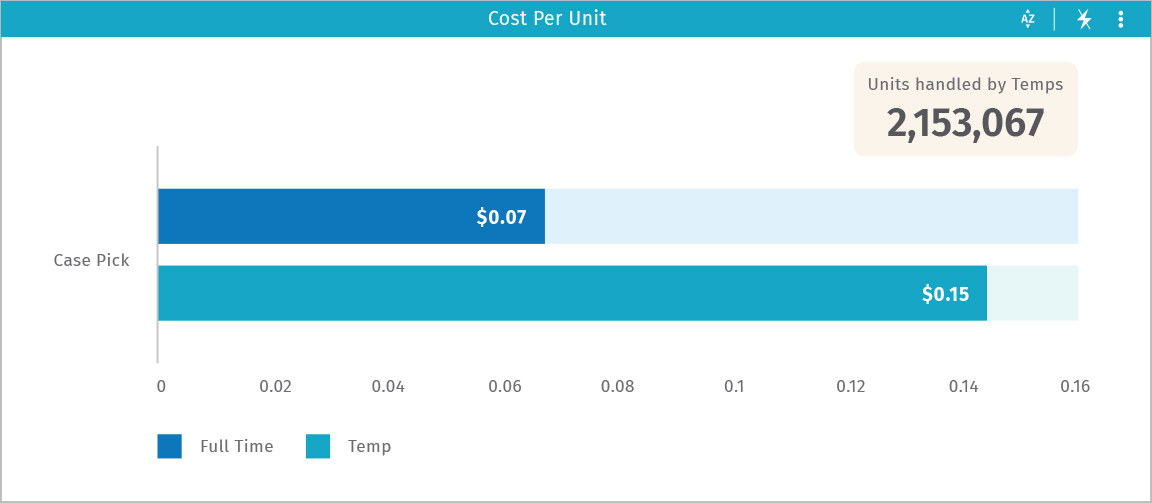
In the Cost per Unit chart (above) and the Potential Savings Chart (below), we can see that the customer could theoretically save $166,559 by switching away from using temporary employees on the Case Pick process because they are costing $.15 per case picked vs $.07/case when the work was done by full-time teammates. Since they had temporary employees pick 2.1MM cases during the analysis period, that higher processing cost had a major impact on the facility’s profitability.
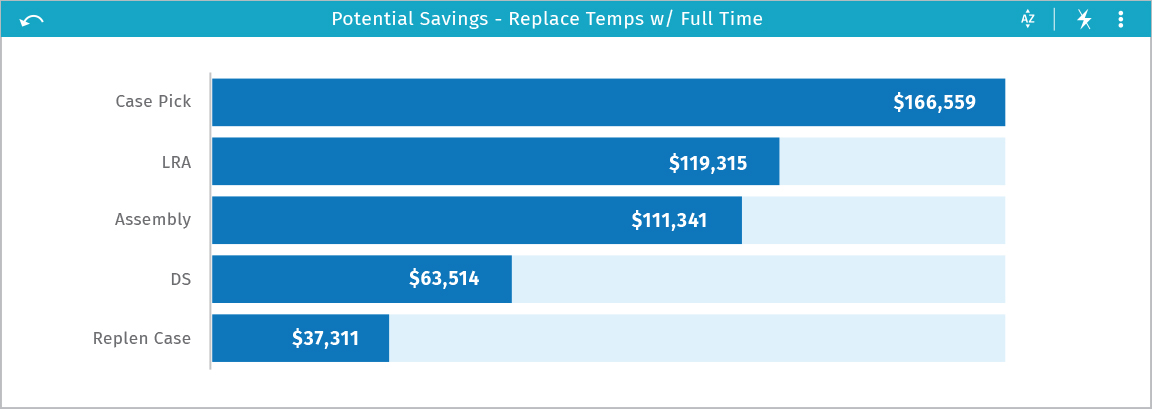
We say this potential savings is “theoretical” because the savings calculations are based on the assumption that they can replace those temporary employees with full time employees who are operating at the same level of productivity as their current full time teammates. That may be difficult in a tight labor market. But having this information broken out by process can still prove beneficial in understanding the impact temporary workers are having on their cost structure and where they should prioritize their efforts to rebalance their staffing allocation.
If you want to find out how much you can save by proper allocation between temporary and full time staff, Easy Metrics can make this project easy, intuitive, and efficient. Find out how by scheduling a call with our sales team.