More accurately manage and predict your labor costs by leveraging product volume and product mix metrics.
This is the first blog in a series dedicated to explaining and clarifying how to use metrics and KPIs in your operation to drive efficiencies and manage your business. Today we’re going to be talking about volume and throughput metrics, and what you can do with them.
Throughput Metric
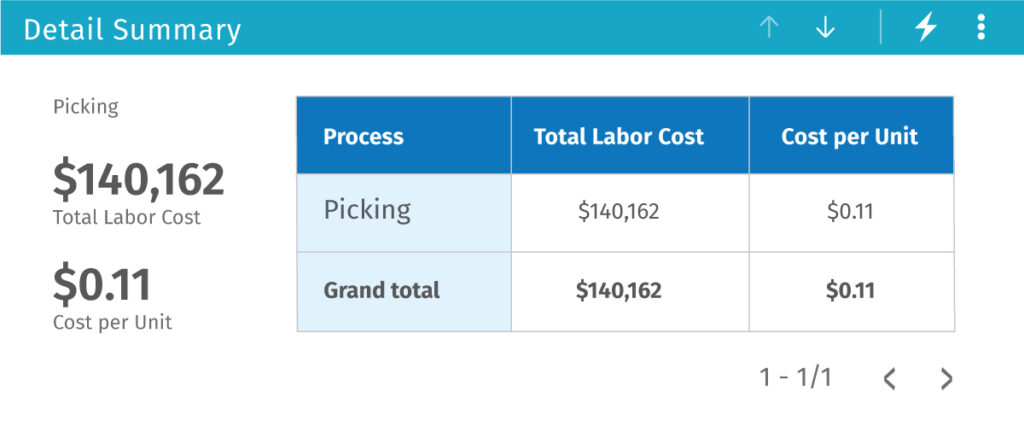
Starting at the top with the most over-arching metric, the Throughput metric is designed to be a top-down overview metric that measures the cost per unit to move through the facility. While this metric doesn’t provide much actionable information on its own (outside of extreme outlier cases), when it’s used as a comparative metric with other facilities in your network of operations it can be a warning sign for potential problems at specific locations or processes.

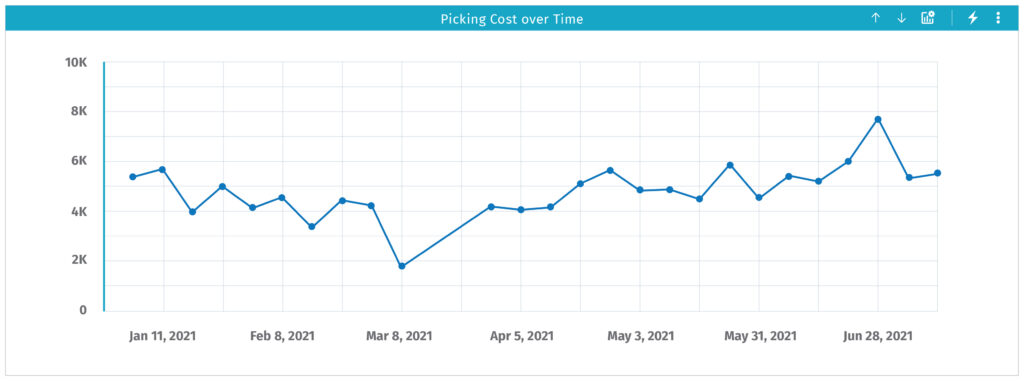
Comparing throughput is most effective when processes are similar across most facilities within a network. It can also be used to see changes in cost for a specific facility; if a facility’s cost rises from $5.50 to $6.75/unit over the last year, throughput should be investigated. Potential avenues of investigation include two metric ratios: lines per order, and units per line.

Lines/Order
The other primary “product mix” metric is Lines per Order. Lines/order provides similar insights to cases/line, but is focused on individual order density rather than overall product volume. Orders composed of high unit volume across many lines are common with retail shipping—which will have its own effects on costs. The more time workers spend picking, the higher the cost per unit will be.
The changing market trends toward eCommerce have significantly impacted Lines/order metrics across many operations due to the increased frequency of 1-2 unit orders. Low Lines/order metrics can also suggest that more work is required to get each order processed and sent out. E-Commerce orders often run at a higher cost per unit because they often have single units from several different lines.


Units/Line
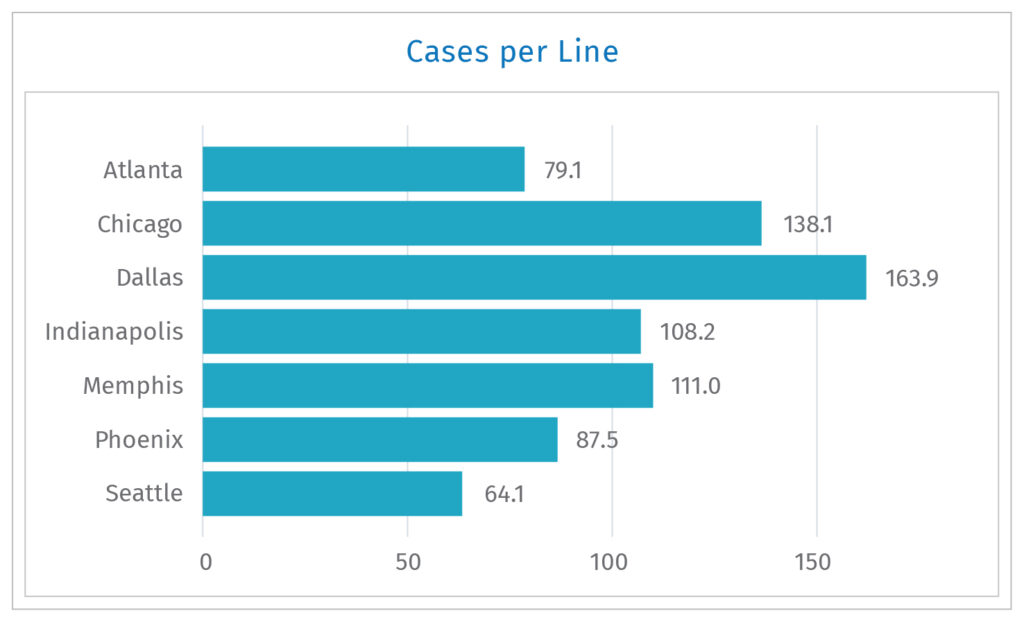
This is one of two primary “product mix” metrics. As with any metric ratio, the number of cases per line of product can be used in multiple ways; Units/line can be used as a volume metric for the facility, but it can also be used as a performance metric for the workers. Units/line can affect an employee’s cases/line or cases/hour score. For example, a high units/line would suggest retail shipping and bulk orders. These are far cheaper than low units/line orders with many lines—workers have fewer product locations to get to, and therefore have a more efficient picking process.

As a primary product mix metric, Units/line directly impacts the Throughput metric, which is why variances in that metric are worth tracking. If an operation sees an increase in Cost per Unit but no change in productivity, then it’s common to see a drop in Units/line (and often a rise in lines/order). The increased cost would suggest that it takes more effort to get each unit through the facility.
A drop in units per line could be caused by:
- Changes in client type
- The loss of a large, consistent client that is replaced by a series of smaller ones would disrupt the previously-stable cadence of products.
- A series of discrete, choppy orders takes more effort to process than a single large one.
This is just one example of how to use units/line to identify changes in costs or productivity in a facility. But there are many others. Once you start measuring it, you will find many use cases.

We hope this article was useful in highlighting some key metrics tracked by high performing operations. These metrics are among many performance and cost metrics built into Easy Metrics. Are you ready to get better insights into your operations? Schedule a call with our sales team to learn more.
Next Blog In This Series: Movement and Travel Metrics


