Leveraging transportation metrics to locate potential cost savings in your facilities
This is our second blog in our series dedicated to explaining and clarifying how to use metrics and KPIs in your operation to drive efficiencies and manage your business. Today we’re going to be talking about movement and travel metrics and how to use them to locate inefficiencies in your operation.
Travel per Line
This is one of the first metrics to check when the Cost per Unit for any given process is higher at one facility than another. Because employees are on-task for the process regardless of distance, productivity scores will be unaffected—but the Cost will go up with increased travel. For example, if Picking at facility A requires employees to move product 50% farther than at facility B, then you’ll notice an increase in cost with no difference in productivity scores.
Distance traveled is a data point that can point directly at physical problems within a facility. Tracking Travel per Line lets you find those problems and fix them. This becomes even more valuable when Travel per Line is combined with the Lines per Order metric we discussed in our previous entry in this series. The relationship between the two is multiplicative; the more disparate lines you have in an order, the more instances of extended travel time you have to pay for. These data points are incredibly useful for cross-facility comparisons, and can help you identify potential inefficiencies and savings opportunities.
Team Lift / Cube (Volume)
How many workers are required to move each item? How many units can each employee move? When it comes to labor costs, the weight of an item can directly affect its Cost per Unit. This metric exists for that reason: to determine which products will require additional worker labor as it moves from process to process in a facility. Adjusting the calculations to determine if a team lift is required provides more insight into the impact of weight on the labor required, and therefore the cost of that labor. It must be noted that this metric is not a requirement to create robust standards. This data is valuable in its ability to further refine existing standards.
Most companies look at this metric in a linear fashion. For example, 10 pounds of product would require double the labor of 5 pounds of product. That linear approach doesn’t align with reality. We look at Weight with the perspective of Team Lift in mind—at what point are additional members necessary. Weight and Team Lift are threshold metrics, not linear ones. Most workers can carry a box that weighs up to 30 pounds—therefore the Team Lift is unchanged up to that point. A 40 or 50 pound box, one that is larger and/or heavier, might require two workers, which means the threshold for increasing Team Lift (and therefore labor cost), is somewhere between 30 and 50 pounds. The cost only increases with the amount of increased labor required.
Verticality Percent
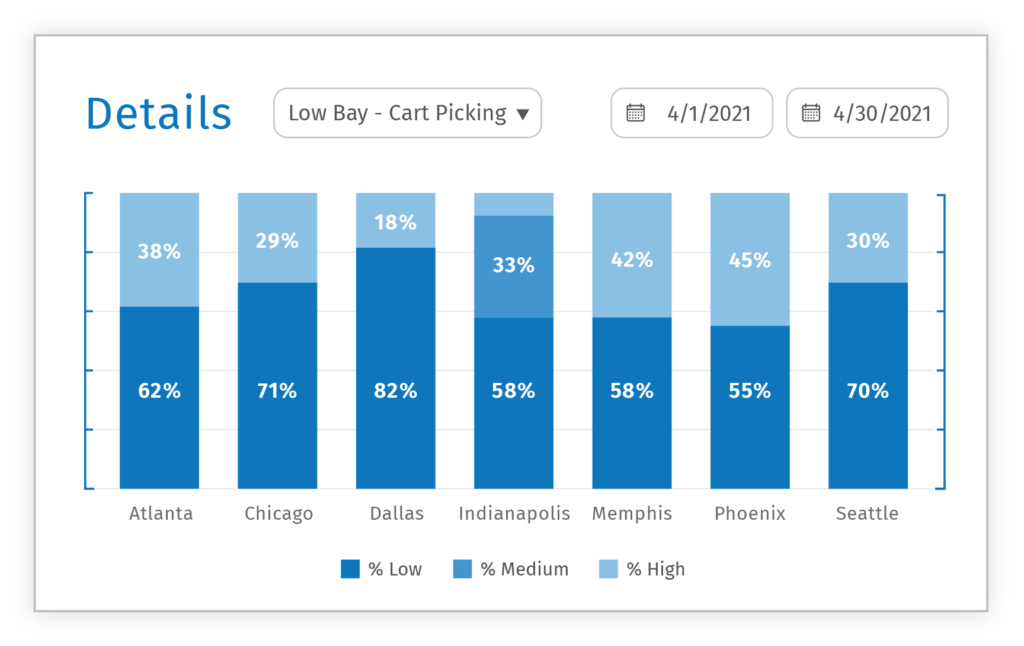
How often do your workers need to use equipment to reach product in your warehouse? Product storage, and therefore product picking, has a vertical component—which affects the costs of those processes. Verticality is a percentage metric that tracks the number of orders requiring that additional vertical labor.

Ideally, the verticality metric has two facets: high% and low%, where high% represents the percentage of orders pulling from those harder-to-reach areas of the warehouse. Minimizing high% is the goal—the fewer orders requiring that increased effort, the lower your costs will be. In our experience, the ideal high% is between 5% and 15%.
We hope this article was useful in highlighting some of the metrics tracked by high performing operations. These metrics are among many performance and cost metrics built into Easy Metrics. Are you ready to get better insights into your operations? Schedule a call with our sales team to learn more.
Previous Blog In This Series: Volume and Throughput Metrics
Next Blog In This Series: Missing Time


